Suaahara Webinar Q&A: Insights on the ‘How To’ Aspects of Implementation
In our September webinar, Dr. Kenda Cunningham and Ms. Pooja Pandey from Helen Keller International presented their experiences and lessons learned implementing Suaahara II, a large-scale multi-sector nutrition program in Nepal. The recording of this live event can be accessed here.
During the moderated Q&A, SISN’s Chief Information Officer, Dr. Mduduzi Mbuya, fielded questions from attendees seeking more details on the ‘how to’ aspects of implementing this project. Given the interest in this topic, the number of questions posed exceeded the time available for our expert speakers to respond, and so they have graciously agreed to share their answers here so that we can collectively gain insights and concrete tips to integrate into practice.
Question 1

Monitoring data is used to track progress in household (HH) and community level behaviors. Each district team has a DHIS2 login to view their results by thematic area, at all times. Suaahara II Frontline workers (FLWs) gather at the district headquarters for a meeting every 2-3 months and at this point, the data is used as a trigger for technical discussions and to guide program implementation priorities over the next couple of months. Suaahara II also has a supportive supervision and quality assurance systems, distinct from monitoring data, which are used to coach, mentor, and guide our own hired FLWs, as well as government health service providers and agriculture extension workers, on the spot.
Question 2

Community leaders from the health and non-health sectors are engaged in all aspects of Suaahara II including conducting joint monitoring and supervision visits. Other community members are not engaged in monitoring and supervision of Suaahara II, but we have a program activity that is designed for this. Community members participate in a self applied tool for health (SATH) and community health and nutrition score board (CHNSB) activities to create indicators and goals for monitoring and holding service providers accountable for delivery of quality nutrition and health services.
Question 3

Sustainability is a key component of Suaahara II. While behavior change is a big area of Suaahara investment, we also work with health and non-health systems (training, coaching and follow-up support, recording and reporting, etc.) to strengthen service quality over a longer time. Also, all activities are implemented via district-specific local NGOs and they hire the frontline workers, who are mostly from the communities where they are working. This ensures that the knowledge and skills gained from engagement with Suaahara remain in the districts and communities. Furthermore, Suaahara II’s governance component includes regular engagement with ward and municipality level leaders who have already started funding the replication of 100s of Suaahara’s activities from their own budgets. We also support and link beneficiaries with local private providers such as agrovets, WASH marts, brooding centers to improve access with affordable services.
Question 4
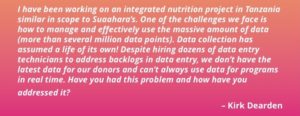
The challenges are real and we can only advance as a community if we are transparent about them and share our strategies for overcoming them. We too are drowning in massive amounts of data, but can offer the following ideas. First, all data collection should be electronic to save a bunch of time by avoiding data entry. Second, investments are needed in systems that enable immediate calculation/analysis of data (for us this was CommCare, DHIS2, and a linking software). Third, prioritization of analysis questions is important; we focus on descriptives, disaggregated descriptives by GESI indicators, and some basic regressions to explore exposure and key behaviors. Fourth, collaborations with universities and other researchers can be a win-win (although time consuming) to getting additional data analysis of interest to the program done. Fifth, donors and implementers have to remain flexible so that as more information is available the activities can be revised and prioritization re-done.
Question 5

Thank you for this great question! The real world is uncontrolled and therefore we can measure individual, HH, and community factors to adjust for, but there will always be factors unmeasured and uncontrolled for. The other question about exposure is interesting. For us, it has been a balance between asking program teams at all levels to focus on fewer activities (but with quality and more reach) and only changing those activities when absolutely necessary. On the other hand, in evidence-based programming, we should expect activities to change and this does generate challenges for measurement. With an annual workplan of 100s of activities and sub-activities, varying by location and reaching about 1 million households, we unfortunately couldn’t track each person/HH exposure to each and every activity. So, we look at exposure with varying degrees of granularity (any awareness of Suaahara; any engagement/activity; and specific groupings of our main components- e.g. home visits, mass media; etc.) To ensure our surveys capture the program well, continual communication between program and MER teams is required; survey tools need to be regularly updated to match program changes.
Question 6

Thank you for this question. During the proposal stage, there is a Theory of Change and a set of indicators required by USAID, with clear guidance on how to construct those indicators. Suaahara also invested in creating detailed program impact pathways by thematic area (e.g., WASH, health, etc.) and attempts to measure as many factors along these pathways as possible, following standardized approaches (e.g. HFIAS for food security, WHO/UNICEF guidelines for IYCF). There are indicators, however, for which clear global guidance does not exist and/or that haven’t been validated and in this case we created our own survey questions mirroring standardized questions as closely as possible.
Question 7

This is a great question! Since Suaahara focuses on 10 prioritized behaviors and a few big SBCC investments (e.g. home visits, mass media, community events including mothers groups), the ongoing data systems have been designed around tracking these overall (annual surveys) and by district (internal monthly monitoring). KTM teams use this information for annual prioritization and field teams implementing the program can use this information for quarterly prioritization. There are many other questions that are at a more detailed, granular level or about newer or pilot-level interventions that may not be answered in the quantitative datasets. Some of these are answered by investing in research studies (qualitative formative research; randomized controlled trials; etc.) While the research may guide the next program, best guesses from experiential learnings are used in the shorter term.
Question 8

This is a really great question and highlights a tension for all of us. The reality is a lot of thoughtful research done in one program is contributing to a global evidence base and a future program rather than giving immediate answers. However, some analysis of monitoring data can guide programming. First, we have invested in systems to shorten the collection to results timeframe (moving to electronic data collection only; DHIS2 dashboards; but also excel dummy tables and Stata cleaning and analysis files updated during data collection). Second, we do not report out preliminary findings but rather we have prioritized and sequenced the reporting out so that it meets donor and program needs but doesnt risk misinformation. For ex, our annual survey data collection finishes the first week of Sept and we have the raw data by Sept end. Within 30 days we provide findings for our almost 100 IPTT (mostly behavioral) USAID indicators and this allows the thematic leads in KTM to know which of their behaviors are progressing vs. not. Witihin another 60 days, we finish analysing and preparing a descriptive report on all of the 1000s of datapoints; this is shared with all implementing teams who use it to guide programming and also to come back to us with additional questions (deeper quant analysis, qual research needed, etc.). Those questions (once prioritized) can either be handled by the MER team or we create collaborations with other researchers to get answers.
Question 9
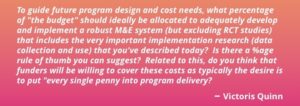
Thanks for this great question. We get this question often because many think that the Suaahara data system isn’t replicable as its too costly. The reality, however, is that the M&E system should mirror the program in complexity and the resources devoted proportional. In other words, the Suaahara system is large and complex because the program is large and complex – we’re measuring what we’re doing! As far as a % rule of thumb, development programs often want to budget 5-10% and Pooja is pushing 15% :). It depends if you want to just do M or do M&E or do M,E, and R…. these are distinct activities that all require resources so if R is added into the mix, for ex, adequate resources (not just data collection but staff with skills for these tasks) should be devoted. It’s also important to remember that data systems truly embedded within programs can SAVE money and prevent wasting money on activities that will be meaningless (e.g. we learned that adolescents dont have mobile phones so canceled our activities to send SMS to them; we learned that more than 75% of grandmothers in a HH where the mother was reached, have also been reached so decided to not have specific activities to reach grandmothers). Finally, MER is a great opportunity for collaborations that can bring money into the program (e.g. cost-share); Suaahara has had this experience and it’s definitely an avenue with a lot of win-win opportunities.
Question 10

We have not yet finished our evaluation, but when we conduct modeling within our monitoring data, we have three major learnings: 1) the answer depends on the behavior and varies across our sectors; 2) the SBC interventions are additive and the greater the exposure, the higher odds of ideal behavior (e.g. 2 platforms better than 1, 3 better than 2, etc.); and 3) the SBC interventions are complementary (e.g. HHs who have had a home visit have higher odds of participating in community events or listening to the radio program; HHs who listen to the radio program have higher odds of participating in mothers groups; etc.). So, in short, we’re not at a stage where we can pick just 1 but rather need multiple platforms to expand our reach and facilitate behavior change.
Question 11

Thanks – this is the million dollar question but we don’t have a specific answer yet. As mentioned above, what we’re seeing is that the more types of interventions/platforms the HH is exposed to, the higher odds of ideal behavior. Also, the answer to all of these questions seems to vary by behavior, the starting point of that behavior, and socio-cultural factors; in a multi-sectoral program, you are trying to improve many behaviors across sectors.
Question 12

We are happy to share with you our program technical briefs which we have for each sector. We can also share our annual survey reports which include our findings on each indicator we measure.
We hope that you found the webinar and Q&A informative. We welcome your thoughts, comments and questions on the topic or the webinar itself. Please send any feedback to: info@implementnutrition.org. We also encourage you to share this with anyone who may find it of interest and be interested in future SISN events.
Save the date for our next webinar “Improving Iron and Folic Acid Supplementation Through Quality Improvement: An Effectiveness-implementation Hybrid Study Type III” scheduled for Wednesday, 4th December 2019 at 9am EST. More details can be found here.

This blog is brought to you courtesy of a grant from the Eleanor Crook Foundation.

